Fun podcast interview with UC Berkeley CS Prof. Joey Gonzalez. We dug into generative AI startups, big companies, vector search / databases, open source, etc. with some examples. Hope these insights are helpful.
COVID-19 data – US deaths for each day we don’t lockdown
tl;dr (3/24/2020):
(1) Total deaths in one month in the US will be 416K at the current rate.
(2) If US locks down like Italy, total deaths in one month drops to 10K – and 6K if our efforts are halfway between Italy’s and China’s (and 3K if like China).
(3) Not fully locking down will result in 1K – 15K additional deaths per day (grows each day) we wait over the next month.
I did some quick analysis over the latest death data (see image below):
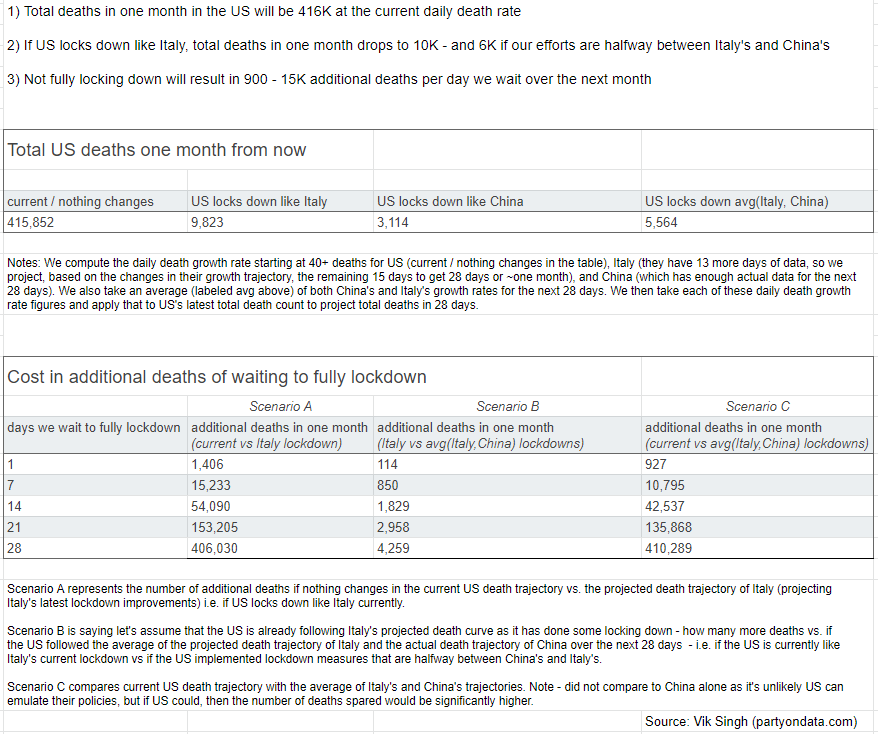
Here’s the spreadsheet with the data and math.
The death count and cost of each day we don’t drop the hammer and implement a complete national lockdown need to be reported and acted on before it’s too late …
I do hope I’m wrong (for ex. Italy’s and US’s daily deaths stabilize soon) and/or we can course correct ASAP to save lives.
Calculate the Sales Performance of Any Company in Two Minutes Flat
Originally published on LATKA’s SaaS.
tl;dr: Run a few searches (patterns provided) on LinkedIn and Google to determine the current reps and churned reps per year for any given company. Divide churned reps per year by the current number of reps to compute the percentage of the current sales team that will churn in one year’s time – producing the Sales Team Churn (STC) metric. Can compute STC for any company (including privately held ones), and compare to other companies’ STCs (see benchmarks table covering several key SaaS companies below).
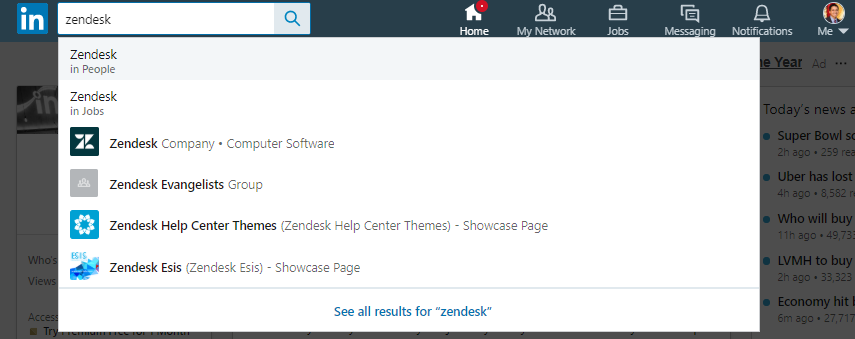
To compute this sales performance metric, you need to run three simple searches.
First, search for the company on LinkedIn – “in People” search:
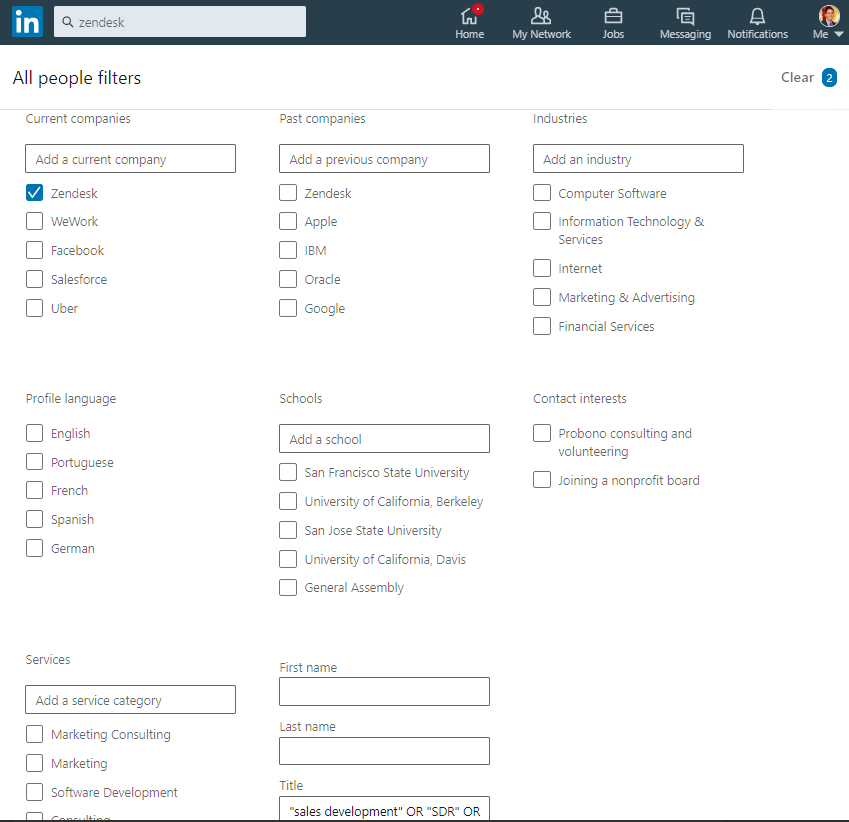
Then click “All Filters” near the top right of the search results page, check the company under “Current companies”, and in the “Title” field (near the bottom of the form), copy and paste the following string:
“sales development” OR “SDR” OR “account executive” OR “sales executive” OR “account manager”
Then click “Apply”.
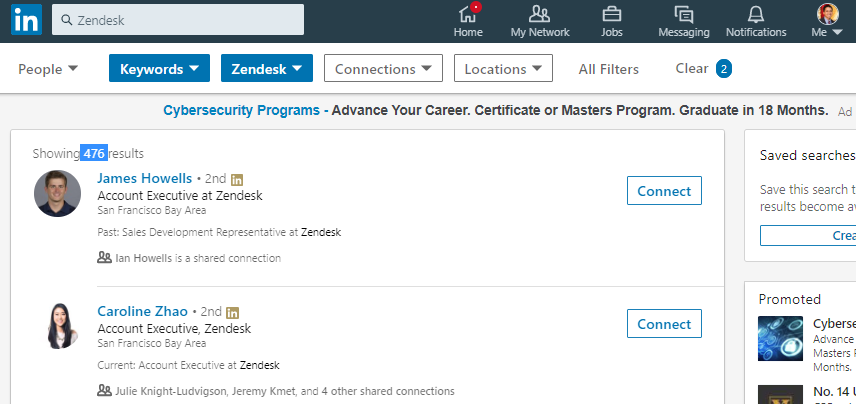
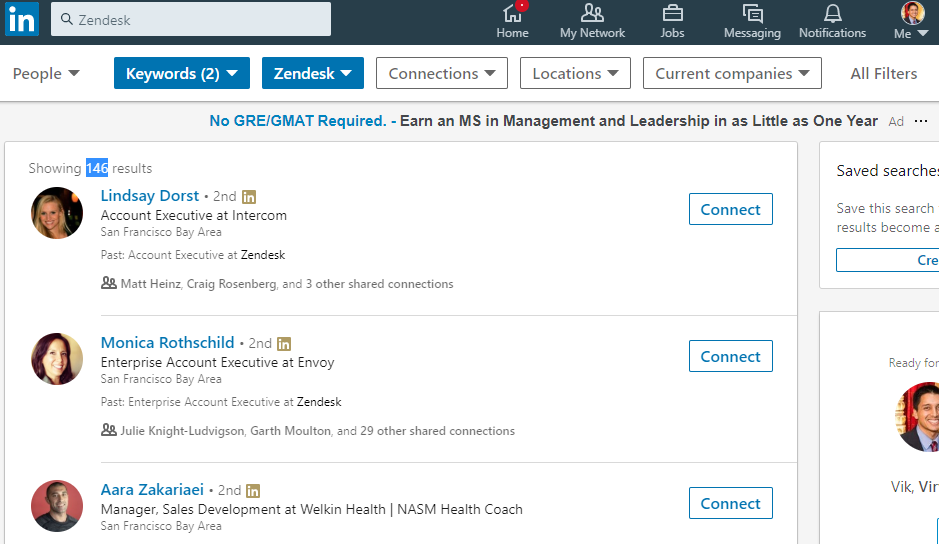
Near the top left of the search results page is the number of results (highlighted in blue in the image below). Save this figure, which represents the current number of sales related heads at the company.
Then click “All Filters” again. Uncheck the company under “Current companies”, and check the company under “Past companies”. In the “Company” field box, enter “-” then the company name (in quotes if company name is more than one token).
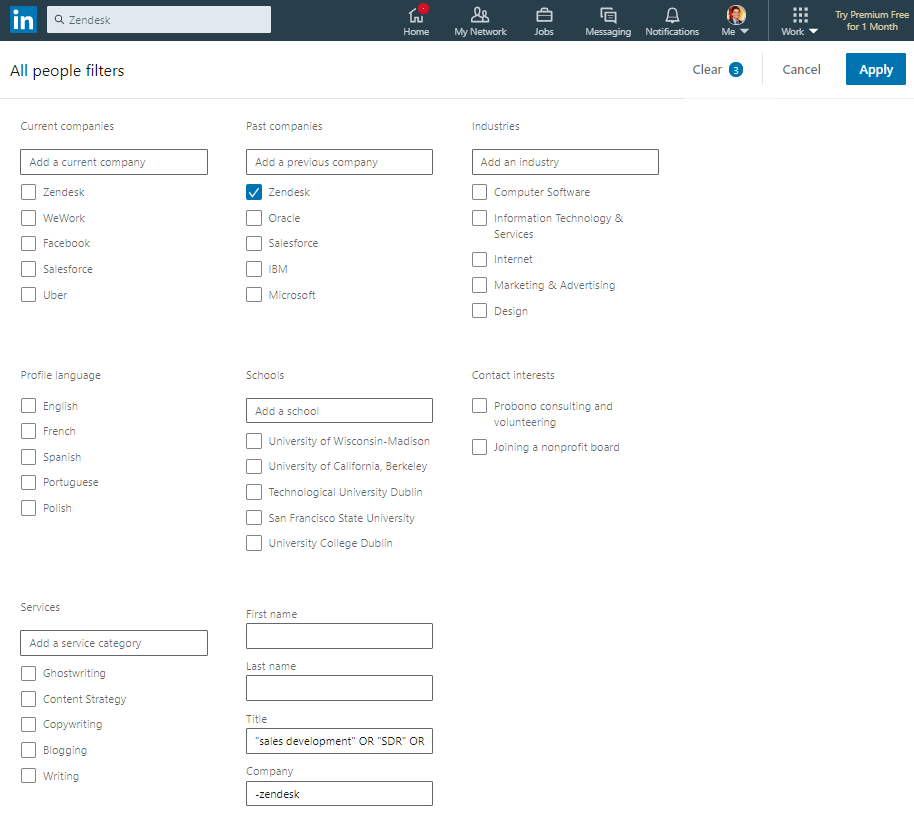
Click “Apply”, and save the number of results, which represents the number of sales related heads that no longer work at the company.
Then search the company name padded with “founded” on Google, and find the date the company was started.
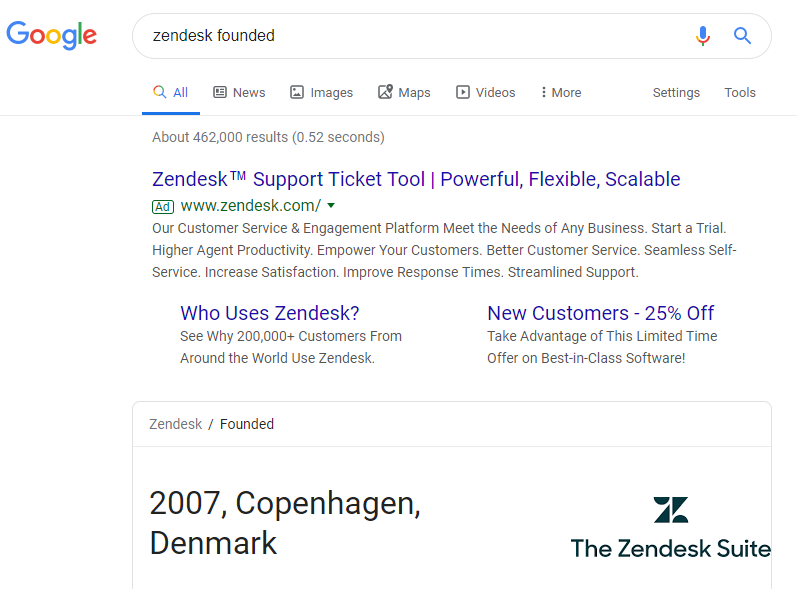
These three searches give us current sales heads, past sales heads, and the founding date of the company.
With these three values, we can calculate the following:
Churned Sales Heads Per Year = Past Sales Heads / Number of Years Since Founded
Sales Team Churn (STC) = Churned Sales Heads Per Year / Current Sales Heads
This metric represents how much of the current sales team will churn in one year (so lower the number the better).
Let’s plug-in the example illustrated in the screenshots above:
Zendesk, founded in 2007, has currently 476 sales related heads, and has lost 146 heads.
Churn per year = 146 / (2019 – 2007) = ~12
STC = 12 / 476 = ~2.5%
So, what’s a good STC score? Here are the metric values for various enterprise companies (full table here):
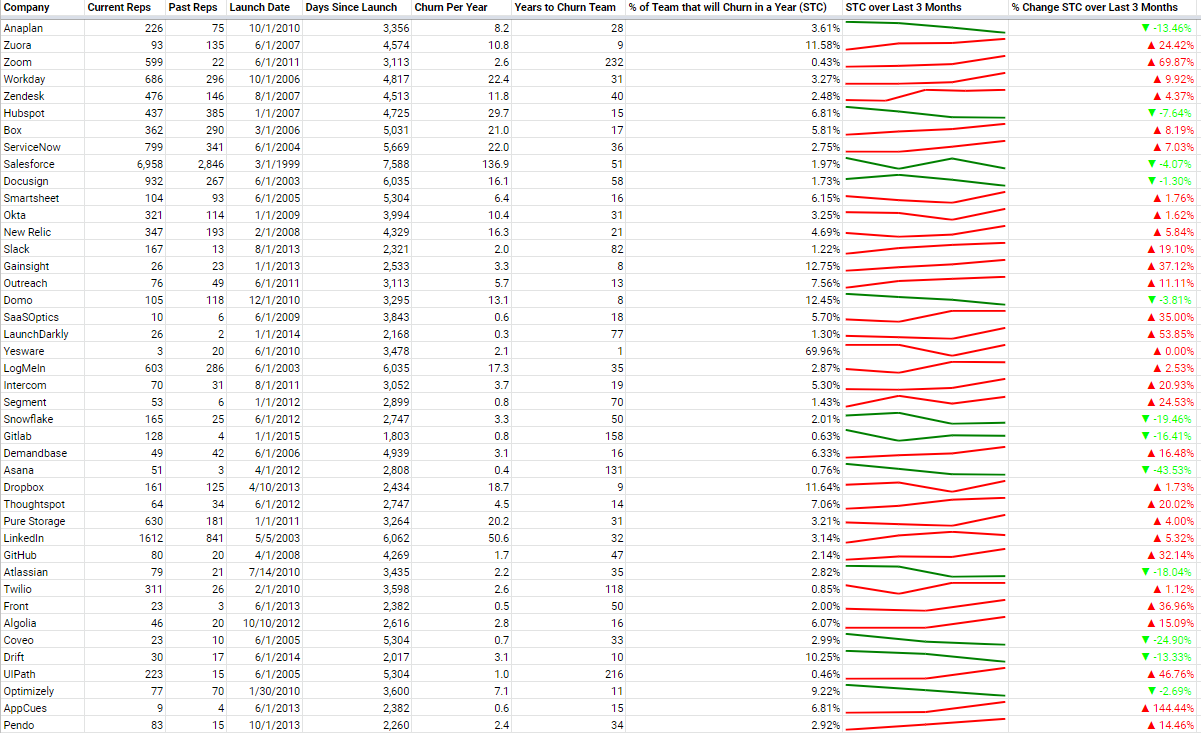
The key columns are the last three. Lower STC the better. Been capturing monthly snapshots of STC values for these basket of companies – sparkline and percentage changed provided in the last two columns. Ideally, STC is below 5%, and the STC is steady or going down over time (in green if going down – otherwise red). See full table here.
The average of this basket of companies is 5.9% – so would recommend targeting under 5% in general. This sounds low, but that’s because churn per year is calculated over all time – since the incorporation date. This is because I was unable to filter LinkedIn search results to a select period of time (like over the past year). In the early years, sales and corresponding sales churn will be low or nonexistent, which heavily down weights this value. As companies age, the number of years increases, and the number of current sales reps increase, which can both lower this score. This is how even a mature company intentionally churning out 10-20% of their sales team annually (to remove bottom performers and raise the bar for all reps) can still score a STC below 5%. The key is to compare STC with other companies at similar stages versus directly comparing with internal annual attrition numbers given the differences in calculation methods and assumptions.
There are many interesting insights to glean from this table. For example, there are several companies with < 1% STC, including LaunchDarkly, Zoom (although growing), Twilio and GitLab – all of which have self-service trial flows.
There are also companies with > 10% STC percentages (to reiterate – this means more than 10% of their sales team will attrit in a year), including Domo, Dropbox, Gainsight and Zuora.
There are interesting competitive benchmarks as well – for ex. Intercom is 5.3% vs Drift’s 10.27% – nearly half of Drift’s sales churn.
I’ve been snapshotting this metric for several months, as it’s also important to look at how STC is changing over time (see last column above – is the sales health getting better or worse?). There are companies on this list who have consistently increased (Gainsight, Zuora) or decreased (Anaplan, Domo) their STC.
So, why the focus on sales team size for assessing the sales performance of a company?
When I was running Infer, I recall my syncs with Aaron Levie (CEO / Co-Founder of Box, and one of our angel investors at the time), and the first question he would always ask was:
“How many salespeople do you have now?”
This is a really great question for assessing a business quickly. The more reps you have, the more deals you can close. The more reps you have, the more market demand you have. The more reps you have, the more you’re spending to drive growth. The more reps you have, the better your hiring process, sales leadership and culture are for attracting talent.
The twist with STC, is that we’re not just looking at the number of present sales people, but also factoring in the attrition rate. So, the less reps churned, the more reps that are hitting their quotas.
C-level executives focus on key business metrics such as gross or net revenue retention. High churn means there’s a leaky bucket, which can sink even a high growth new ARR business.
This applies not just to customers, but to sales reps too – often overlooked compared to customer churn. If a company is losing a good chunk of their sales team each year, then the company is losing the ability to generate and close revenue making opportunities, and has to spend to hire new reps – and burn valuable time ramping them.
In general, sales reps face higher risks of attrition than those in other functions. Their goals are measurable, and if they miss, they’re fired or leave – and the best performing reps can receive promotions and make more money elsewhere. But even if higher attrition is expected, what is the healthy, right amount of attrition for any given company to experience?
Losing reps is very much a leaky bucket just like customer churn, and deserves metrics and magic numbers to abide to – hence STC and the 5% target.
The STC metric has several nice properties:
It’s accessible, and can be computed for any company (unlike revenue which is hard to reliably discern for private companies). Anyone can quickly and easily derive this metric with a free LinkedIn Account. It does not require internal financials – so it’s fully transparent internally and externally. The metric is normalized, so can compare companies’ STCs for benchmarking purposes. This metric updates often (as sales people tend to update their profiles quickly). It’s also a more forward looking indicator than revenue (need sales people first before closing more deals).
This metric can also be adapted to different roles outside of sales by simply changing the title query (could tailor to executive management roles with search tokens like “Chief”, “VP”, etc.).
VPs of Sales, CEOs, VCs, VPs of FP&A, job candidates, hedge fund quants, etc. should be leveraging STC-like metrics for planning models, researching competitive landscapes and evaluating investments or job opportunities.
Special thanks to the following for reviewing drafts of this piece:
Ajay Agarwal, George Bischof, Matt Cooley, David Gilmour, Amar Goel, Naren Gupta, Nathan Latka, Nick Mehta, David Kellogg, Vish Makhijani, Tomasz Tunguz and Jeff Weiner.
***
Do note, some technical caveats regarding this approach for computing STC:
Can be difficult to be precise with LinkedIn’s search. Two examples: (1) company name may overlap with other companies with similar names (2) can’t search past titles (at least via the free account) (3) have to negate ‘-’ company name in order to find people that worked in the past at a company and are no longer at that company
If a company is fresh and hasn’t had any churn (or really low churn), then this is meaningless (it has the best STC score). Just means they haven’t had enough sales team churn yet. Still useful to look at comparable companies who’ve been in-market longer and use their STC scores for headcount planning / forecasting.
Different companies use different sales titles. May need to adjust the title query on a per company basis.
The sales titles query does not exclusively correspond to quota carrying reps.
Not everyone is on LinkedIn. This is usually not a problem for sales reps as they typically want to advertise themselves in order to be able to connect with potential customers – esp. at tech companies. Even when not all sales reps are accounted for (when a rep is not on LinkedIn or the title query doesn’t capture that person), I find that this metric is still directionally useful especially on a relative basis with other companies (it’s consistently sampling each company in the same manner).
Why Atlassian will be a $50B company in 10 years
An op-ed I wrote for VentureBeat:
Last week, Atlassian made a very smart move by acquiring Trello. While $425 million implies a high multiple (given Trello’s revenue run rate was around $10 million last year), I believe it positions Atlassian to become the next big enterprise software company. I project it will reach a $50 billion market cap in 10 years by taking over software for teams. Here are four reasons why:
What I learned working under Turing Award winner Jim Gray – 10 years since his disappearance
A few days ago, I sent out the following email remembering Jim to close friends and colleagues. I did not intend to share this broadly, but I received many positive replies encouraging me to post this publicly … so, here it is:
10 years ago this month, my mentor and idol Jim Gray disappeared at sea. I had the greatest fortune to work under him. We had published a paper together in the weeks leading up to his final sail.
I learned so much from Jim, and I think about him a lot. We even incorporated our company name after his saying “party on the data” (Party On Data, Inc.). To this day, I continue to unpack and internalize the lessons that I absorbed while working with him more than a decade ago.
I learned it’s important to make time for the unexpected. It felt like nearly everyone I knew in my circle had talked to Jim at some point – even people from very different fields of study. I am not sure how he was able to be so generous with his time given his position and stature, but if someone reached out to him with an interesting hook and was passionate about it, he made time. And, it wasn’t just a meet and greet – he truly listened. He would be engrossed in the conversation, and listen intently like you were the professor and he was the student. He made you feel special; that you had some unique insight about a very important problem area.
Jim’s projects were proof that making time and having an open mind for the unexpected – to converse and collaborate with people beyond your direct connections – can lead to breakthroughs in other disciplines. He made significant contributions to the SkyServer project, which helped astronomers federate multiple terabytes of images to serve as a virtual observatory (a world-wide telescope). He applied a similar approach to mapping data with the Virtual Earth project (the precursor to Google Maps – minus the AJAX).
In today’s world, with so many distractions and communication channels (many of which are being inundated with spam), it has become commonplace to ignore cold inbound requests. However, I learned from Jim that it’s crucial to make time for surprises, and to give back. No other Turing award winner responded to my emails and calls – only Jim did – and by doing so, he completely changed my life for the better. Jim instilled confidence in me that I mattered in this world, if someone important like him was willing to invest his precious time with me.
I learned from Jim that it’s important to tackle very good and crisp problems – and to work diligently on them (and to write everything down). Jim had a knack for identifying great problems. Comb through his website – it’s hard to find a dud in his resume or project list. I remember we were in talks with a major hospital about an ambitious project to improve the detection of diseases. The hospital group was willing to support this high profile project in any way we needed (thanks to Jim being a rock star), but Jim immediately knew we wouldn’t be able to develop crisp, tangible results within a year. He wanted more control, and craved a project with more short-term wins.
When Jim did identify a crisp problem to work on, he went all-in. His work ethic was second to none. We were once at a baseball game together, and I could tell from his demeanor that he was itching to get back to the office to continue our work. If I was working late in the office, he would work late too. He remained technical (writing code right next to me) and deep in the weeds despite his senior management role. He was responsive. Late night emails to emails at 5 AM (he liked waking up with the birds). He pushed me to work harder – not by asking for it, but by leading by example.
With any project, but especially database projects, there are so many low-level, unsexy problems (like data cleaning) that have to be addressed before you can “party on the data.” “99% perspiration and 1% inspiration,” he would always say, like it was a constant, inevitable force of nature that we have to equip ourselves for. He prepared me for that, which taught me how to stay focused and work harder.
I learned that it’s important to learn about key inflection points from previous products and projects – to know your history in order to make better decisions. Jim was a master story teller – constantly reciting history. I still remember his story about how Sybase was outgunned in the database market, but their innovation with stored procedures gave them the differentiation they needed to fight the fight with DB2 and Oracle. And, by the way, he was very laudatory of key features coming from competitors. He would never dismiss them – he loved the innovation, no matter where it came from. He wanted the truth for how to best solve a particular problem.
He loved to teach his lessons too. I recall one time I asked him a technical question, and an important call came through to his desk phone. He immediately hung up the call and took me to the whiteboard to teach me what he knew about the topic in question. Who does that? You’d be lucky to meet with your thesis advisor or manager once a week for 30 minutes, but Jim was present for me like this almost every day.
Jim set the highest management bar imaginable for me. He showed me why I should optimize 100% for mentorship throughout my career – not company brand – and to do this every time.
I sometimes wish he could see me now, as I feel like I wasn’t able to show him everything that I could do then, as I was still in the infancy of my career. I know better now where I excel (and where I don’t). At the time, I wanted to learn and do it all, like there was no tomorrow. He encouraged me to follow my passions – even if they were outside his comfort zone. Jim had no ego – he would loop in another mentor who knew more about a particular subject area. He gave me rope to learn, fail and rebuild. I tried to savor every minute I had with Jim, and am thankful that I did.
Despite his amazing technical accomplishments, I honestly do not remember many of the technical concepts that he had taught me. What I remember is how he made me feel. That’s what lives on and matters most. He gave me confidence, by just responding to me, and of course, working side by side with me. He rewarded my proactive outreach (which certainly encouraged me to send many more cold emails thereafter), and most importantly, taught me how to approach and solve big problems.
Jim truly inspires me, and I am forever grateful for what he did for me and my career. I sincerely hope that one day, I too, can have such a profound positive influence on so many people’s lives.
To being tenacious like Jim.
AI First, the Overhype and the Last Mile Problem
AI is hot, I mean really hot. VCs love it, pouring in over $1.5B in just the first half of this year. Consumer companies like Google and Facebook also love AI, with notable apps like Newsfeed, Messenger, Google Photos, Gmail and Search leveraging machine learning to improve their relevance. And it’s now spreading into the enterprise, with moves like Salesforce unveiling Einstein, Microsoft’s Cortana / Azure ML, Oracle with Intelligent App Cloud, SAP’s Application Intelligence, and Google with Tensorflow (and their TPUs).
As a founder of an emerging AI company in the enterprise space, I’ve been following these recent moves by the big titans closely because they put us (as well as many other ventures) in an interesting spot. How do we position ourselves and compete in this environment?
In this post, I’ll share some of my thoughts and experiences around the whole concept of AI-First, the “last mile” problems of AI that many companies ignore, the overhype issue that’s facing our industry today (especially as larger players enter the game), and my predictions for when we’ll reach mass AI adoption.
Defining AI-First vs. AI-Later
A few years ago, I wrote about the key tenets of building Predictive-First applications, something that’s synonymous to the idea of AI-First, which Google is pushing. A great example of Predictive-First is Pandora (disclosure: Infer customer). Pandora didn’t try to redo the music player UI — there were many services that did that, and arguably better. Instead, they focused on making their service intelligent, by providing relevant recommendations. No need to build or manage playlists. This key differentiation led to their rise in popularity, and that differentiation depended on data intelligence that started on day one. Predictive wasn’t sprinkled on later (that’s AI-Later, not AI-First, and there’s a big difference … keep reading).
If you are building an AI-First application, you need to follow the data — and you need a lot of data — so you would likely gravitate towards integrating with big platforms (as in big companies with customers) that have APIs to pull data from.
For example, a system like CRM.
There’s so much valuable data in a CRM system, but five years ago, pretty much no one was applying machine learning to this data to improve sales. The data was, and still is for many companies, untapped. There’s got to be more to CRM than basic data entry and reporting, right? If we could apply machine learning, and if it worked, it could drive more revenue for companies. Who would say no to this?
So naturally, we (Infer) went after CRM (Salesforce, Dynamics, SAP C4C), along with the marketing automation platforms (Marketo, Eloqua, Pardot, HubSpot) and even custom sales and marketing databases (via REST APIs). We helped usher a new category around Predictive Sales and Marketing.
We can’t complain much — we’ve amassed the largest customer base in our space, and have published dozens of case studies showcasing customers achieving results like 9x improvements in conversion rates and 12x ROI via vastly better qualification and nurturing programs.
But it was hard to build our solutions, and remains hard to do so at scale. It’s not because the data science is hard (although that’s an area we take pride in going deep on), it’s the end-to-end product and packaging that’s really tough to get right. We call this the last mile problem, and I believe this is an issue for any AI product — whether in the enterprise or consumer space.
Now, with machine learning infrastructure in the open — with flowing (and free) documentation, how-to guides, online courses, open source libraries, cloud services, etc. — machine learning is being democratized.
Anyone can model data. Some do it better than others, especially those with more infrastructure (for deep learning and huge data sets) and a better understanding of the algorithms and the underlying data. You may occasionally get pretty close with off-the-shelf approaches, but it’s almost always better to optimize for a particular problem. By doing so, you’ll not only squeeze out better or slightly better performance, but the understanding you gain from going deep will help you generalize and handle new data inputs better — which is key for knowing how to explain, fix, tweak and train the model over time to maintain or improve performance.
But still, this isn’t the hardest part. This is the sexy, fun part (well, for the most part … the data cleaning and matching may or may not be depending on who you talk to :).
The hardest part is creating stickiness.
The Last Mile of AI
How do you get regular business users to depend on your predictions, even though they won’t understand all of the science that went into calculating them? You want them to trust the predictions, to understand how to best leverage them to drive value, and to change their workflows to depend on them.
This is the last mile problem. It is a very hard problem — and it’s a product problem, not a data scientist problem. Having an army of data scientists isn’t going to make this problem better. In fact, it may make it worse, as data scientists typically want to focus on modeling, which may lead to over-investing in that aspect versus thinking about the end-to-end user experience.
To solve last mile problems, vendors need to successfully tackle three critical components:
1) Getting “predictive everywhere” with integrations
It’s very important to understand where the user needs their predictions — and this may not be in just one system, but many. We had to provide open APIs and build direct integrations for Marketo, Eloqua, Salesforce, Microsoft Dynamics, HubSpot, Pardot, Google Analytics and Microsoft Power BI.
Integrating into these systems is not fun. Each one has it own challenges: how to push predictions into records without locking out users who are editing at the same time; how to pull all the behavioral activity data out to determine when a prospect will be ready to buy (without exceeding the API limits); how to populate predictions across millions of records in minutes not hours; etc.
These are hard software and systems problems (99% perspiration). In fact, the integration work likely consumed more time than our modeling work.
This is what it means to be truly “predictive everywhere.” Some companies like Salesforce are touting this idea, but it’s closed to their stack. For specific solutions like predictive lead scoring, this falls apart quickly, because most mid-market and enterprise companies run lead scoring in marketing automation systems like Marketo, Eloqua and Hubspot.
Last mile here means you’re investing more in integrating predictions into other systems than in your own user experience or portal. You go to where the user already is — that’s how you get sticky — not by trying to create new behavior for them to do on your own site (even if you can make your site look way prettier and function better). What matters is stickiness. Period.
2) Building trust
Trust is paramount to achieving success with predictive solutions. It doesn’t matter if your model works if the user doesn’t act on it or believe in it. A key area to establish trust around is the data, and specifically the external data (i.e. signals not in the CRM or marketing automation platforms — a big trick we employ to improve our models and to de-noise dirty CRM data).
Sometimes, customers want external signals that aren’t just useful for improving model performance. Signals like whether a business offers a Free Trial on their website might also play an important operational role in helping a company take different actions for specific types of leads or contacts. For example, with profiling and predictive scoring solutions, they could filter and define a segment, predict the winners from that group and prioritize personalized sales and marketing programs to target those prospects.
In addition to exposing our tens of thousands of external signals, another way we build trust is by making it easy and flexible to customize our solution to the unique needs and expectations of each customer. Some companies may need multiple models, by region / market / product line (when there is enough training data) or “lenses” (essentially, normalizing another model that has more data) when there isn’t enough data. They then need a system that guides them on how to determine those solutions and tradeoffs. Some companies care about the timing of deals; they may have particular cycle times they want to optimize for or they may want their predictions to bias towards higher deal size, higher LTV, etc.
Some customers want the models to update as they close more deals. This is known as retraining the model, but over retraining could result in bad performance. For example, say you’re continuously and automatically retraining with every new example, but the customer was in the middle of a messy data migration process. It would have been better to wait until that migration completed to avoid incorrectly skewing the model for that period of time. What you need is model monitoring, which gauges live performance and notices dips or opportunities to improve performance when there’s new data. The platform then alerts the vendor and the customer, and finally results in a proper retraining.
Additionally, keep in mind that not all predictions will be accurate, and the customer will sometimes see these errors. It’s important to provide them with options to report such feedback via an active process that actually results in improvements in the models. Customers expect their vendor to be deep on details like these. Remember, for many people AI still feels like voodoo, science fiction and too blackbox-like (despite the industry’s best efforts to visualize and explain models). Customers want transparent controls that support a variety of configurations in order to believe, and thus, operationalize a machine-learned model.
3) Making predictive disappear with proven use cases
Finally, let’s talk about use cases and making predictive disappear in a product. This is a crucial dimension and a clear sign of a mature AI-First company. There are a lot of early startups selling AI as their product to business users. However, most business users don’t want or should want AI — they want a solution to a problem. AI is not a solution, but an optimization technique. At Infer, we support three primary applications (or use cases) to help sales and marketing teams: Qualification, Nurturing and Net New. We provide workflows that you can install in your automation systems to leverage our predictive tech and make each of these use cases more intelligent. However, we could position and sell these apps without even mentioning the word predictive because it’s all about the business value.
In our space, most VPs of Sales or Marketing don’t have Ph.Ds in computer science or statistics. They want more revenue, not a machine learning tutorial. Our pitch then goes something like this …
“Here are three apps for driving more revenue. Here’s how each app looks in our portal and here are the workflows in action in your automation systems … here are the ROI visualizations for each app … let’s run through a bunch of customer references and success studies for the apps that you care about. Oh, and our apps happen to leverage a variety predictive models that we’ll expose to you too if you want to go deep on those.”
Predictive is core to the value but not what we lead with. Where we are different is in the lengths we go to guide our customers with real-world playbooks, to formulate and vet models that best serve their individual use cases, and to help them establish sticky workflows that drive consistent success. We’ll initially sell customers one application, and hopefully, over time, the depth of our use cases will impress them so much that we’ll cross-sell them into all three apps. This approach has been huge for us. It’s also been a major differentiator — we achieved our best-ever competitive win rate this year (despite 2016 being the most competitive) by talking less about predictive.
Vendors that are overdoing the predictive and AI talk are missing the point and don’t realize that data science is a behind-the-scenes optimization. Don’t get me wrong, it’s sexy tech, it’s a fun category to be in (certainly helps with engineering recruiting) and it makes for great marketing buzz, but that positioning is not terribly helpful in the later stages of a deal or for driving customer success.
The focus needs to be on the value. When I hear companies just talking about predictive, and not about value or use cases / applications, I think they’re playing a dangerous game for themselves as well as for the market. It hurts them as that’s not something you can differentiate on any more (remember, anyone can model). Sure, your model may be better, but the end buyer can’t tell the difference or may not be willing (or understand how) to run a rigorous evaluation to see those differences.
The Overhype Issue
Vendors in our space often over-promise and under-deliver, resulting in many churn cases, which, in turn, hurts the reputation of the predictive category overall. At first, this was just a problem with the startups in our space, but now we’re seeing it from the big companies as well. That’s even more dangerous, as they have bigger voice boxes and reach. It makes sense that the incumbents want to sprinkle AI-powered features into their existing products in order to quickly impact thousands of their customers. But with predictive, trust is paramount.
Historically, in the enterprise, the market has been accustomed to overhyped products that don’t ship for years from their initial marketing debuts. However, in this space, I’d argue that overhyping is the last thing you should do. You need to build trust and success first. You need to under-promise and over-deliver.
Can the Giants Really Go Deep on AI?
The key is to hyper focus on one end-to-end use case and go deep to start, do that well with a few customers, learn, repeat with more, and keep going. You can’t just usher out an AI solution to many business customers at once, although that temptation is there for a bigger company. Why only release something to 5% of your base when you can generate way more revenue if it’s rolled out to everyone? This forces a big company to build a more simplified, “checkbox” predictive solution for the sake of scale, but that won’t work for mid-market and enterprise companies, which need many more controls to address complex, but common, scenarios like multiple markets and objective targets.
Such a simplified approach caters better to smaller customers that desire turnkey products, but unlike non-predictive enterprise solutions, predictive solutions face a big problem with smaller companies — a data limiting challenge. You need a lot of data for AI, and most small businesses don’t have enough transactions in their databases to machine learn patterns from (I also would contend that most small companies shouldn’t be focusing on optimizing their sales and marketing functions anyway, but rather on building a product and a team).
So, inherently, AI is biased towards mid-market / enterprise accounts, but their demands are so particular that they need a deeper solution that’s harder to productize for thousands. Figuring out how to build such a scalable product is much better done within a startup vs. in a big company, given the incredible focus and patience that’s needed.
AI really does work for many applications, but more vendors need to get good at solving the last mile — the 80% that depends less on AI and more on building the vehicle that runs with AI. This is where emerging companies like Infer have an advantage. We have the patience, focus, and depth to solve these last mile problems end-to-end — and to do it in a manner that’s open to every platform — not just closed off to one company’s ecosystem. This matters (especially with respect to the sales and marketing space, in which almost every company runs a fragmented stack with many vendors).
It’s also much easier to solve these end-to-end problems without the legacy issues of an industry giant. At Infer, we started out with AI from the very beginning (AI-First), not AI-Later like most of these bigger companies. Many of them will encounter challenges when it comes to processing data in a way that’s amenable for modeling, monitoring, etc. We’re already seeing these large vendors having to forge big cloud partnerships to rehaul their backends in order to address their scaling issues. I actually think some of the marketing automation companies still won’t be able to improve their scale, given how dependent they are on legacy backend design that wasn’t meant to handle expensive data mining workloads.
Many of these companies will also need to curtail security requirements stemming from the days of moving companies over to the cloud. Some of their legacy security provisions may prevent them from even looking at or analyzing a customer’s data (which is obviously important for modeling).
When you solve one problem really well, the predictive piece almost disappears to the end user (like with our three applications). That’s the litmus test of a good AI-powered business application. But, that’s not what we’re seeing from the big companies and most startups. It’s quite the opposite — in fact, we’re seeing more over generalization.
They’re making machine learning feel like AWS infrastructure. Just build a model in their cloud and connect it somehow to your business database like CRM. After five years of experience in this game, I’ll bet our bank that approach won’t result in sticky adoption. Machine learning is not like AWS, which you can just spin up and magically connect to some system. “It’s not commoditizable like EC2” (Prof. Manning at Stanford). It’s much more nuanced and personalized based on each use case. And this approach doesn’t address the last mile problems which are harder and typically more expensive than the modeling part!
From AI Hype to Mass Adoption
There aren’t yet thousands of companies running their growth with AI. It will take time, just like it took Eloqua and Marketo time to build up the marketing automation category. We’re grateful that the bigger companies like Microsoft, Oracle, Salesforce, Adobe, IBM and SAP are helping market this industry better than we could ever do.
I strongly believe every company will be using predictive to drive growth within the next 10 years. It just doesn’t make sense not to, when we can get a company up and running in a week, show them the ROI value via simulations, and only then ask them to pay for it. Additionally, there are a variety of lightweight ways to leverage predictive for growth (such as powering key forecasting metrics and dashboards) that don’t require process changes if you’re in the middle of org changes or data migrations.
In an AI-First world, every business must ask the question: What if our competitor is using predictive and achieving 3x better conversion rates as a result? The solution is simple — adopt AI as well and prop up the arms race.
I encourage all emerging AI companies to remain heads down and focus on customer success and last mile product problems. Go deep, iterate with a few companies and grow the base wisely. Under-promise and over-deliver. Let the bigger companies pay for your marketing with their big voice boxes which they’re really flexing now. Doing so, you’ll likely succeed beyond measure — and who knows, we may even replace the incumbents in the process.
4 Products Microsoft and LinkedIn Need to Ship
An op-ed piece I wrote for VentureBeat:
Last week, Microsoft stunned the tech world with the largest ever software acquisition – the purchase of LinkedIn for $26.2 billion. While early news coverage has addressed plans to keep LinkedIn independent, there’s been little discussion about what exactly the two companies will do together. As someone who’s entrenched in the LinkedIn and Microsoft ecosystems, I thought I’d share four exciting products this acquisition makes possible:
1. Redefined business email
The quickest and broadest impact Microsoft can make with LinkedIn is to redesign its Outlook interface. The companies could easily bring LinkedIn insights, profile photos, etc. into the email experience (similar to what Rapportive offers today but with a seamless, actionable approach). Outlook could even show recent updates and thought leadership pieces from a particular profile as talking point suggestions to automatically populate in an email when selected.
Microsoft could also add automated email filtering and prioritization features with folder recommendations that improve email productivity. Imagine if you could get emails that meet certain criteria — say they come from a particular job title and are second-degree connections with at least 500 connections themselves — to stick in the top of your inbox until they receive your attention.
Amazon, Google and Apple vs the Big 5 Unicorns on Hiring and Churn
I’ve received multiple requests to analyze employee churn and new hiring rates for big companies and unicorns with the approach I took earlier for studying engineering and sales retention rates. I figured I’d give it a shot – and combine all of the key metrics in one chart …
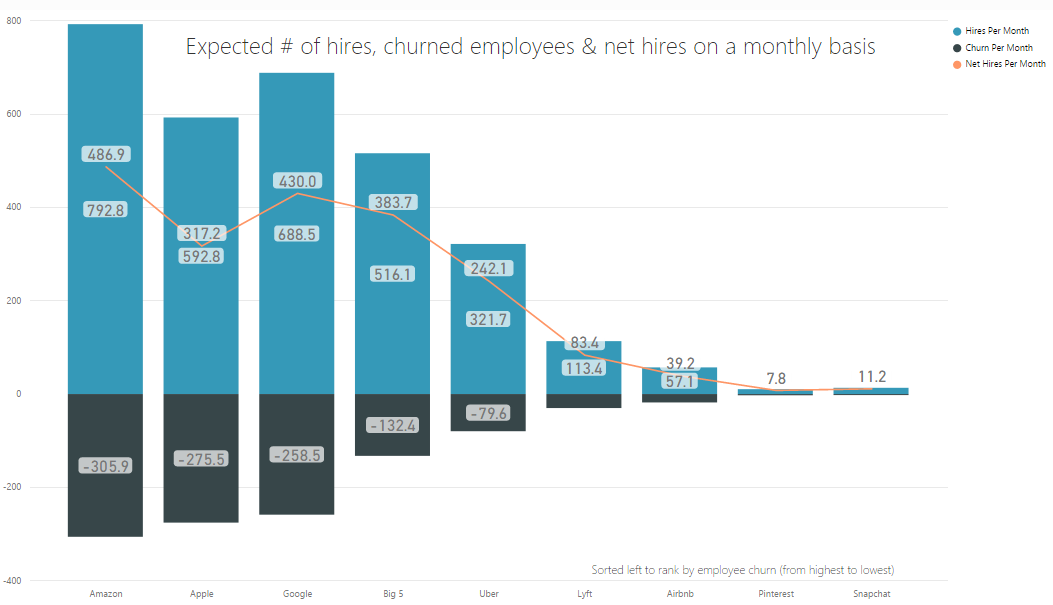
How to read this:
Blue bar represents the number of expected new hires that particular company will make in a 30 day (one month) period. Black bars (negative values) indicate how many employees will churn in a one month period. The orange line (the top most numerical labels correspond to the orange line plot) represent the net change in hires per month (new hires less churn). The companies are ranked by churn from left to right in descending order (so highest churn on the left).
As you can see in the chart, the big three companies included in this analysis are Amazon, Apple and Google. The unicorns are Uber, Lyft, Airbnb, Pinterest and Snapchat. “Big 5” combines these unicorns together as if they were one whole company. Also note, this is looking at employees worldwide with any job title.
Key Insights:
- Apple is not hiring enough new heads when compared with Amazon and Google. In fact, the Big 5 unicorns combined will hire more net heads than Apple with almost 50% less employee churn.
- Amazon’s churn is the highest – losing a little over 10 people a day. However, this is not bad relatively speaking – Google loses 8-9 people a day, and Apple is a tad over 9 a day (and Amazon has 36% more employees than Google). Given the recent press bashing Amazon’s culture and the periodic press envying Google’s great benefits, their retention rates tell a different a story – that it’s closer to a wash. Big tech companies with great talent churn people at pretty similar high rates regardless it seems (have some more thoughts on this but will save those for another post).
- At these current rates, all of the companies here (collectively) will increase their employee size by 20K (19, 414 to be precise) heads by year end (this is new hires less churn). That’s a measly 5% increase in their current collective employee size – and this is across the Big 3 Tech Companies and Big 5 Unicorns.
- Let’s compare Amazon to the Big 5 Unicorns. The Big 5 will hire 79% as many incremental heads as Amazon in a month, even though their collective employee size is 24% that of Amazon’s. Amazon has been in business for much longer (2-3x days since incorporation), and the Big 5’s churn is 43% of Amazon’s figure – both factors contributing to the closeness in the incremental head rate between the two.
Want more details?
How did I calculate these figures? Take a look at my previous post on engineering retention for more details. Same caveats listed there apply here, and then some (such as how this depends on the participation rates of LinkedIn which may differ considerably internationally compared to the US market which my previous posts exclusively focused on). Feel free to connect or email me if you have any questions or feedback.
Ranking Companies on Sales Culture & Retention
A company’s sales retention rate is a very important indicator of business health. If you have a good gauge on this, you could better answer questions such as: should I join that company’s sales department, will I be able to progress up the ladder, are reps hitting their numbers, are they providing effective training, should I invest money in this business, etc. But how does one measure this rate especially from an outside vantage point? This is where LinkedIn comes to the rescue. I essentially cross applied the approach I took to measuring engineering retention to sales.
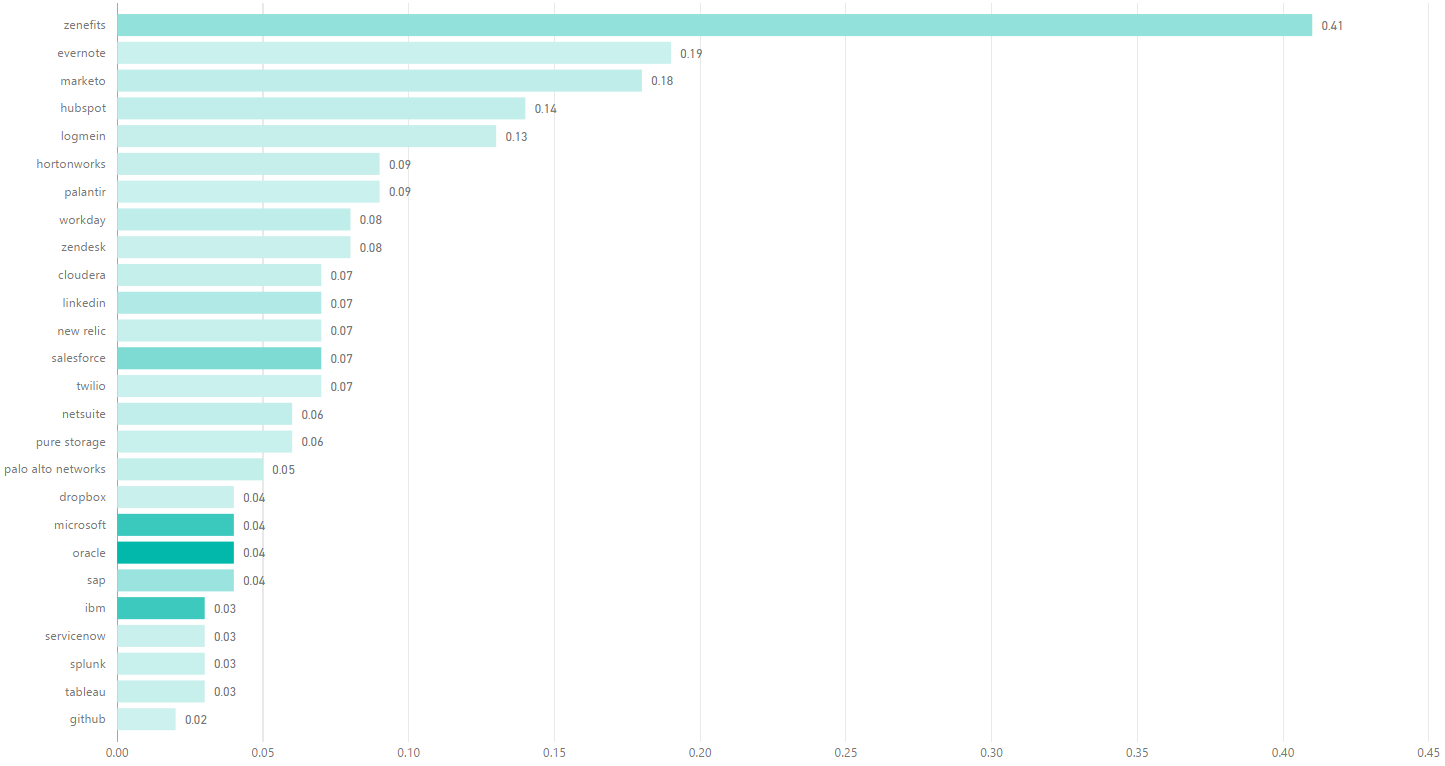
This chart reveals several key technology companies ranked in reverse order of sales churn – so higher on the chart (or longer the bar) the higher the churn (so from worst at the top to best at the bottom).
So how are we defining sales churn here? I calculated the measurement as follows: I took the number of people who have ever churned in a sales role from the company and divide that by the number of days since incorporation for that respective company (call this Churn Per Day), and then I compute the ratio of how many sales people will churn in one year (the run rate i.e. Churn Per Day * 365) over the number of current sales people employed.
For ex. if you look at the top row, which is Zenefits, the value is 0.40 – which means that 40% of the current sales team size will churn in a one year period. In order to maintain that sales team size and corresponding revenue, the company will need to hire 40% of their team – and sooner than in a year as that churn likely spreads throughout the year as well as given new sales hire ramping periods (if you’re churning a ramped rep and say it takes one quarter to ramp a new sales rep, then you need to hire a new head at least one quarter beforehand to avoid a revenue dip).
A few more notes:
The color saturation indicates Churn Per Day – the darker the color, the higher the Churn Per Day.
Caveats listed in the previous post on engineering retention apply to this analysis too.
Top Tech Companies Ranked By Engineering Retention
(TL;DR) Here’s the ranking going from top to bottom (so higher / longer the better):
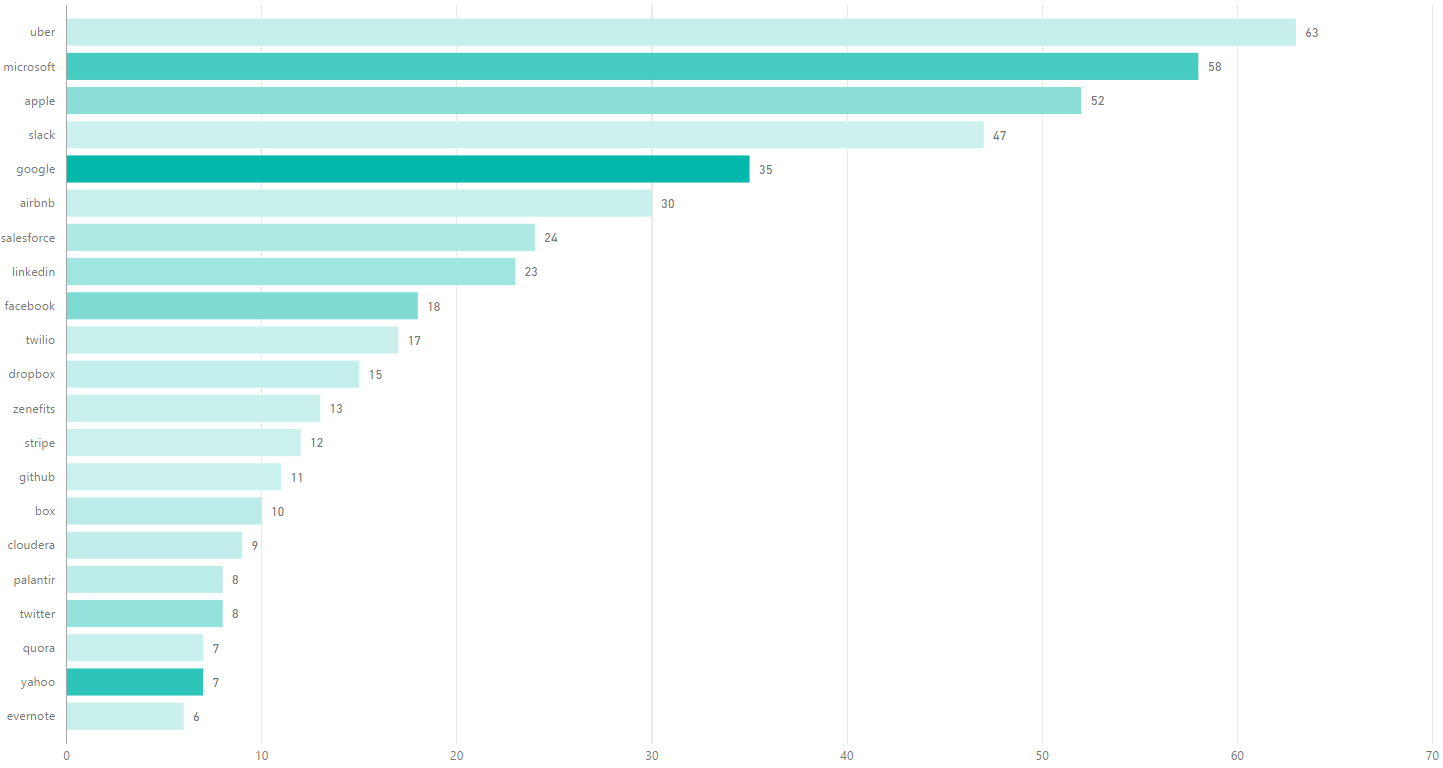
How did you measure this?
By running advanced Linkedin searches and counting up the hits. Specifically, for each company, at their headquarters location only, I searched for profiles that were or are software engineers, and had at least 1+ years of experience. Then I filtered these results in two ways:
1) Counting how many of those profiles used to work at the company in question (and not currently). Call this result Past Not Current Count.
2) Separately (not applying the above filter), filtering to those who are currently working at the company for at least 1+ years. Call this Current Count.
I also computed the number of days since incorporation for each respective company to be able to compute Churn Per Day – which is simply dividing Past Not Current Count by the number of days since incorporation.
Then I took this rate, and computed how long in years it would take for each company to churn through all of their Current Count or current heads who were or are software engineers and who’ve been with the company for at least 1 year (those who possess the most tribal wisdom and arguably deserve more retention benefits). Call this the Wipeout Period (in years) figure. This is what’s plotted in the chart above and is represented by the size of the bars – so longer the better for a company.
What does the color hue indicate?
The Churn Per Day (described in the previous answer). The darker the color the higher the churn rate.
Who’s safe and who’s at risk?
I would think under a 10 year wipeout period (esp. if you’re a larger and mature company) would be very scary.
In general (disclaimer – subjective – would like to run this over more comps) greater than 20 years feels safe, but if you’re dark green (and hence experience more churn per day) then in order to keep your wipeout period long you need to be hiring many new engineering heads constantly (but you may not always be hot in tech to be able to maintain such a hiring pace!).
What are the caveats with this analysis?
There are several, but to mention a few:
Past Not Current Count biases against older companies – for ex. Microsoft has had more churn than # of present heads because they’ve been in business for a long time.
I needed more precise filtering options than what was available from Linkedin to be able to properly remove software internships (although could argue that’s still valid churn – means that the company wasn’t able to pipeline them into another internship or full-time position) as well as ensure that the Past Not Current Count factored only software engineers at the time that they were working at that company. So, given the lack of these filters, a better description for the above chart would be Ranking Retention of Folks with Software Experience.
Also, this analysis assumes the Churn Per Day figure is the same for all folks currently 1+ years at their respective company, even though it’s likely that the churn rate is different depending the # of years you’re at the company (I’m essentially assuming it’s a wash – that the distributions of the historical Past Not Current vs Current are similar).
